
The Thunder Don't Actually Shoot That Many Free Throws
They excel by outshooting their opponents and forcing turnovers.

The Oklahoma City Thunder have long been considered the favorites to win the NBA Championship by my Elo-based forecasting model. As of today’s refresh, they have about a 39 percent chance of winning the title this season.
For the most part, I agree with the model’s output. The Thunder won a league-best 68 games this season. They also set an NBA record for average point differential, outscoring opponents by 12.9 points per game. It makes sense they’d be the clear favorites.
Betting markets mostly agree: DraftKings currently lists OKC at +140 to win the championship, implying about a 42 percent probability.
Despite all that, one of the most common critiques I hear on social media is that the model is overrating the Thunder because officials call fewer fouls in the playoffs. The thinking goes: because officials call fewer fouls in the playoffs, the Thunder’s free throw advantage will shrink, thus exposing them as overrated by my model, which is trained mostly on regular season data.
On the surface, this seems like a reasonable assertion. Fewer fouls are called in the playoffs, and players are generally allowed to play more physically without consequences from the refs.
But the argument has a major flaw: The Thunder don’t actually rely on free throws to win games. Instead, they have thrived by outshooting their opponents and forcing significantly more turnovers than they commit.
The Thunder Win Without the Whistle
Let’s get this out of the way: the Thunder don’t shoot that many free throws. Oklahoma City averaged just 20.4 free throw attempts per game this season — 26th in the league. And if you look at free throw rate (a normalized metric showing free throws per field goal attempt), they rank even lower: 28th out of 30 teams. They shot just 0.22 free throws per field goal attempt.
This free throw theory seems to hinge largely on the idea that Thunder star Shai Gilgeous-Alexander is a “foul merchant.” In other words: that he games the refs, exaggerates contact, and exploits the rules to rack up free throws.
To be fair, SGA does get to the line a lot. He was second in free throw attempts per game this season behind Giannis Antetokounmpo. (If I didn’t know any better, I’d say there’s a strong correlation between free throw attempts and name length. But that theory kind of falls apart when #3 is… Trey Young.)
And as a Denver Nuggets fan, I get it. Plays like this are frustrating:
But the fact remains: The Thunder didn’t win games by drawing fouls. They won by outshooting their opponents, taking care of the ball, and forcing a whole lot of turnovers.
OKC Outshot Their Opponents by a Considerable Margin
Of Dean Oliver’s famous “Four Factors,” the one most predictive of team success is net effective field goal percentage — a team’s effective field goal percentage minus that of its opponents.
Effective field goal percentage is similar to regular field goal percentage but adjusts for the added value of three-pointers, which are worth 50% more than twos:
That pattern held true during the 2024–25 NBA season. The graph below shows each team’s net eFG% plotted against their winning percentage.
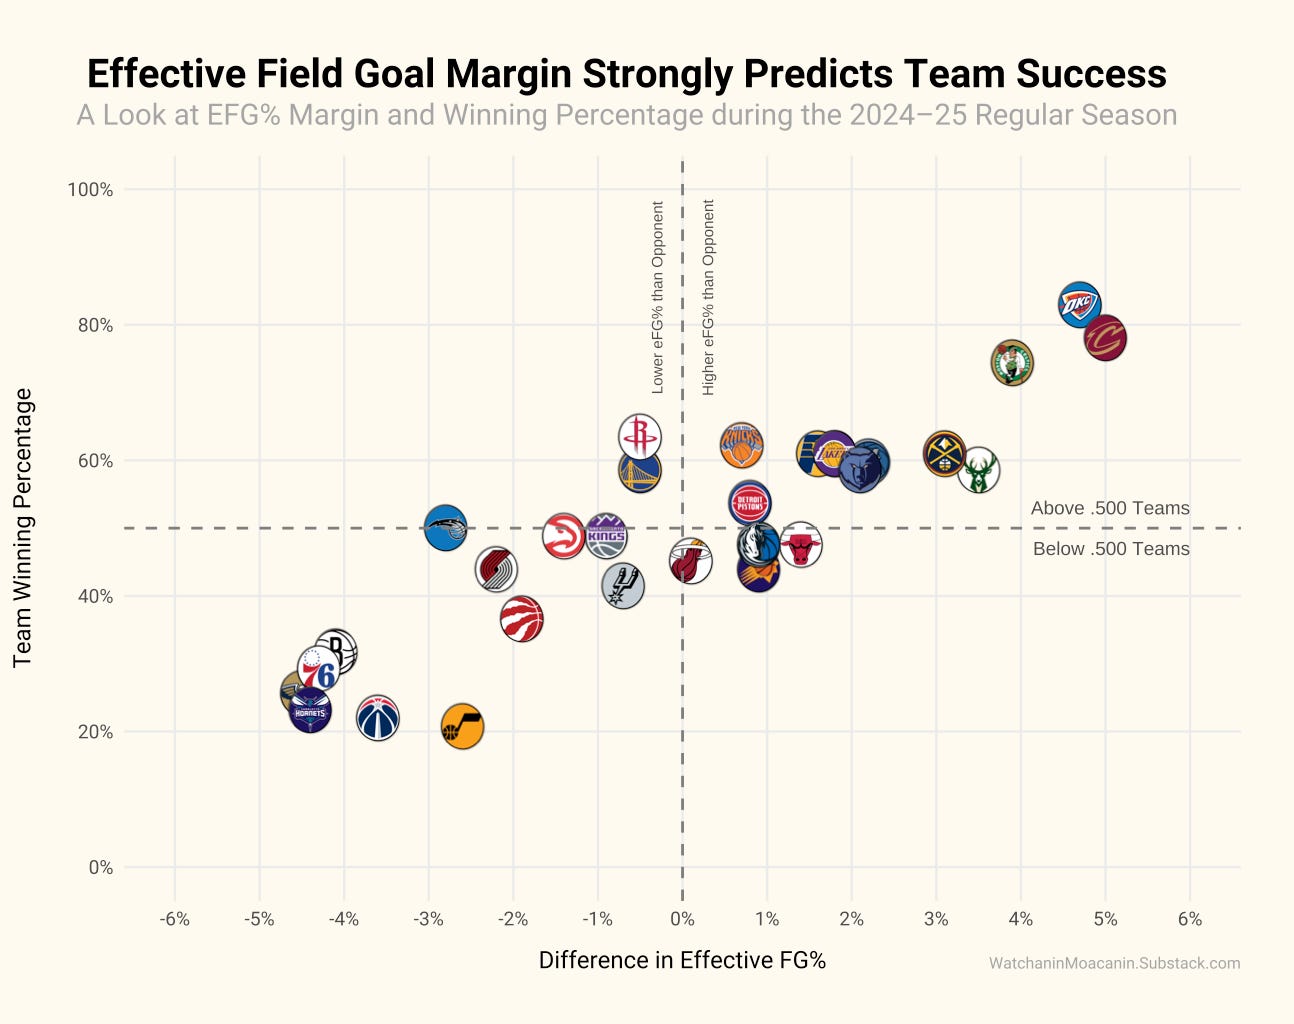
As you can see, the relationship is strong. The correlation coefficient was 0.885. Additionally, a regression analysis suggests that net eFG% explains about 78% of the variation in team winning percentage.
Fortunately for the Thunder, net eFG% was one of two areas where they truly dominated this season. They ranked 7th in eFG% at 56% and held opponents to a league-best 51.3%. That gave them a net eFG% of +4.7% — second only to Cleveland’s +5.0%.
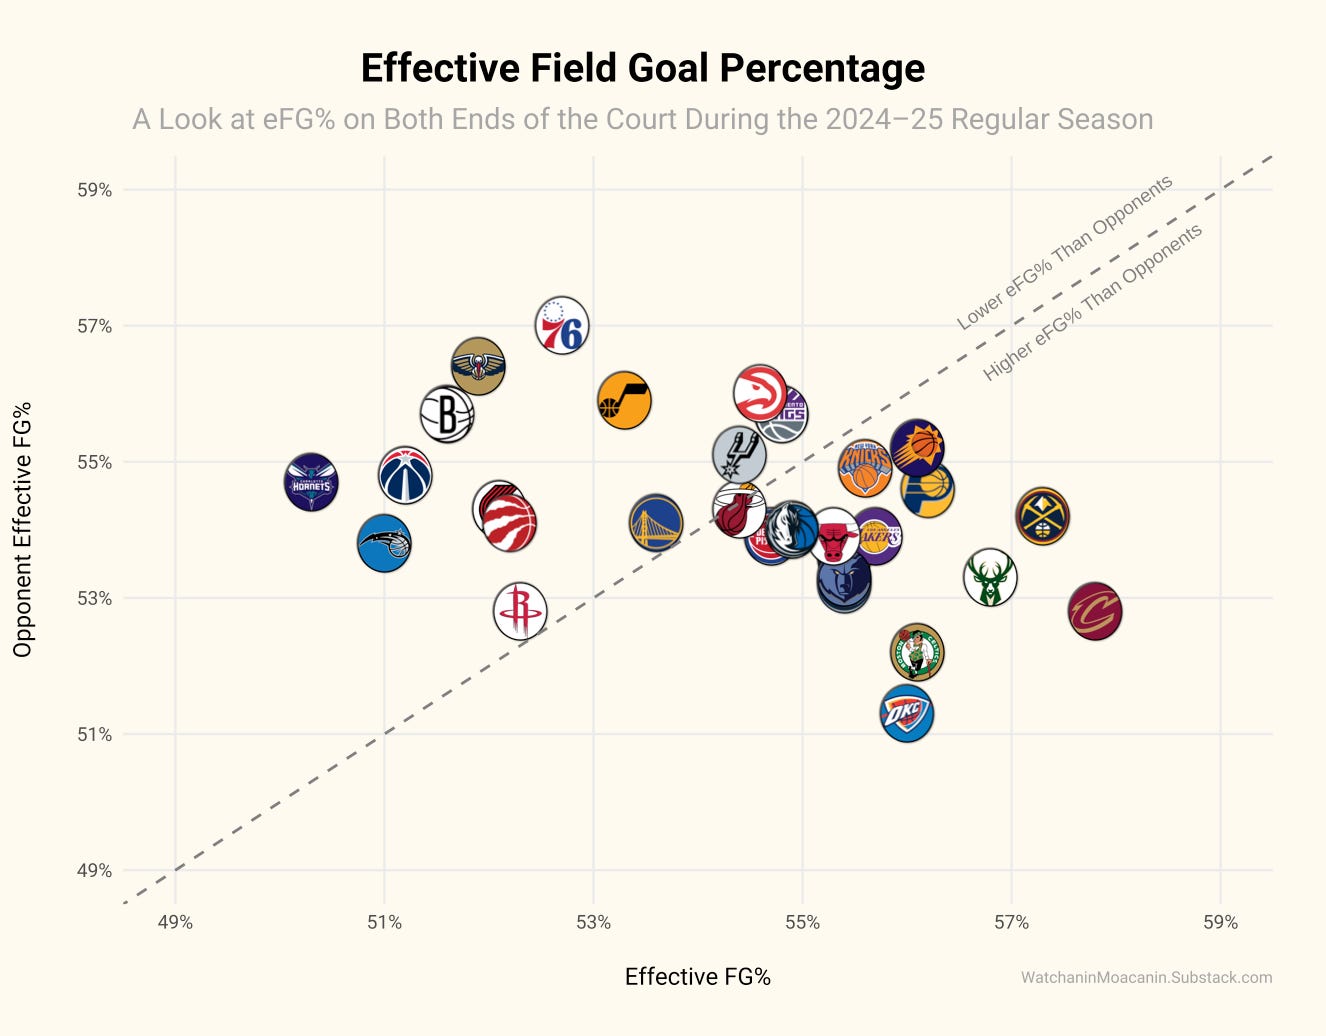
You might be wondering: Given that the Cavs had a higher net eFG% than the Thunder, how did OKC finish with a better record? The answer likely lies in the other area where they dominated: turnover margin.
OKC’s Turnover Rate Was Off the Charts
In the graph below, I plotted each team’s turnover rate (i.e. the number of turnovers they committed per 100 possessions) on the x-axis and their opponent’s turnover rate (i.e. the number of turnovers they forced per 100 possessions) on the y-axis.
It looks like a typical scatterplot... until you try to find OKC. Notice anything weird?
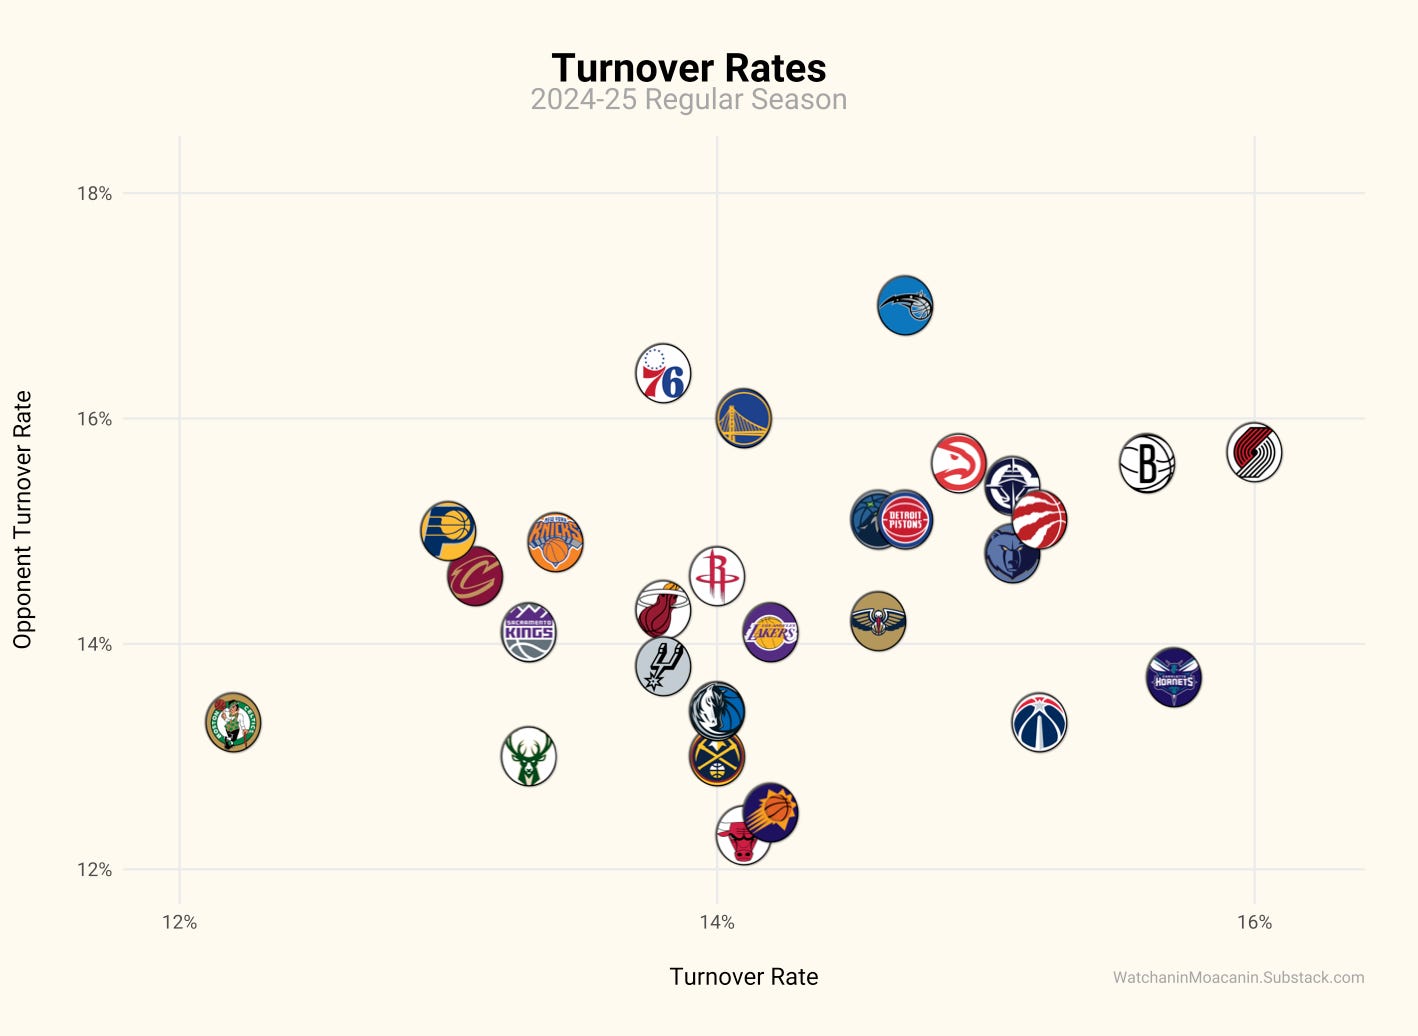
If you’re having trouble finding the Thunder, it’s because, well, they’re not there. I set the x-axis to go from 12% to 16.2%. Since OKC’s turnover rate was 11.6%, they are literally—and figuratively—off the charts.
Here’s the full version, zoomed out so you can see where the Thunder landed:
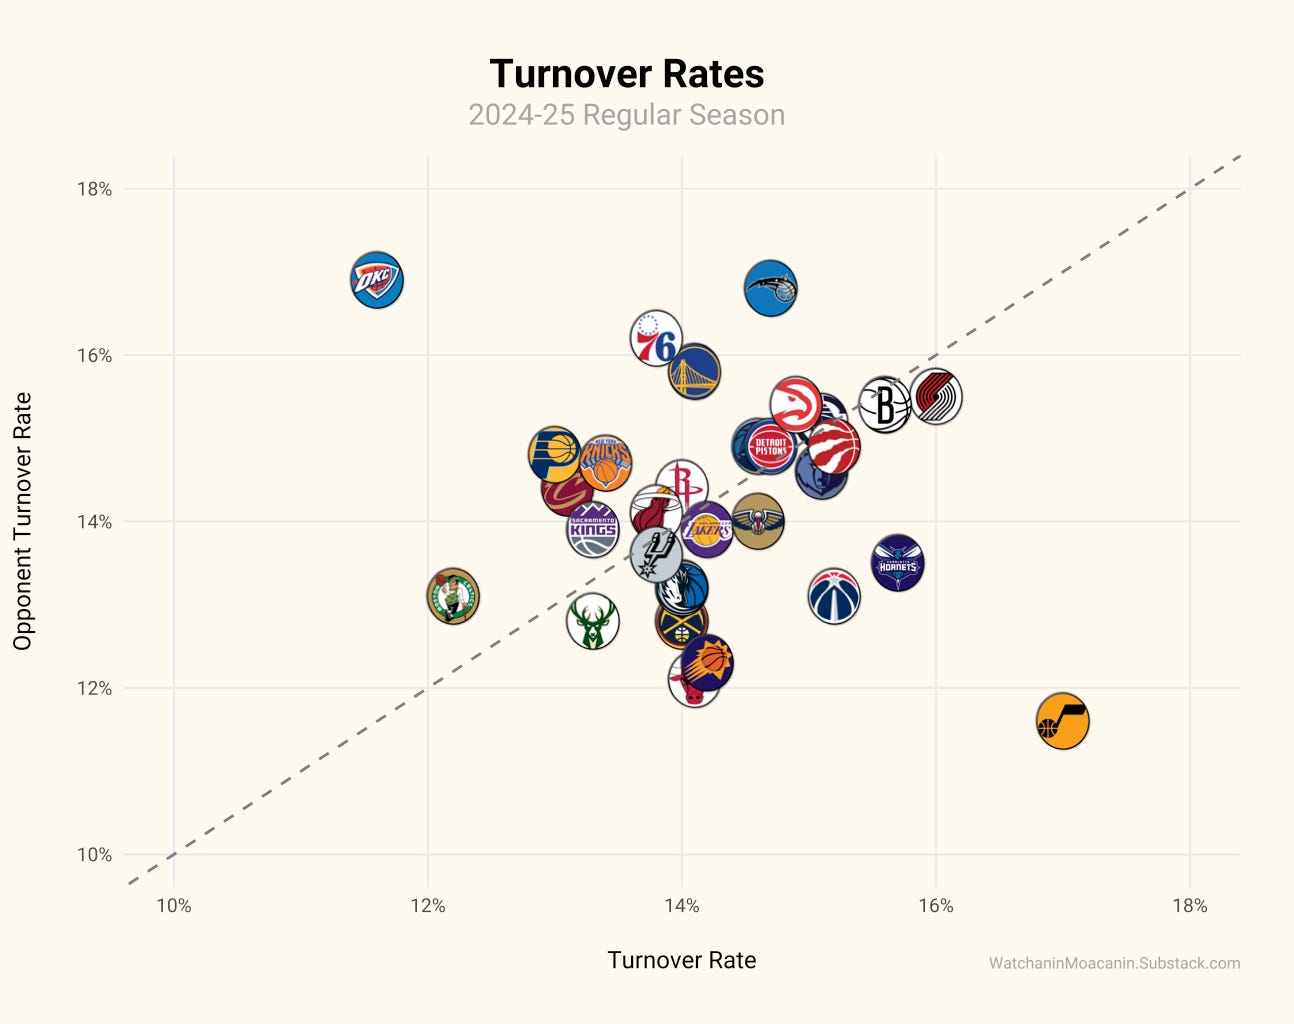
OKC was in a league of their own. They committed just 11.6 turnovers per 100 possessions — best in the league. And they forced 16.9 turnovers per 100 possessions — also best in the league.
Some back-of-the-envelope math suggests this could lead to an extra 6.3 points per game for the Thunder. A net turnover rate of +5.3 means about 5.3 more shots per game than their opponents. Since they had an eFG% of 56%, they score roughly 1.12 points per shot, thus leading to an additional 6.3 points per game. (Of course, this doesn’t factor in free throws or second-chance points.)
For those of you who are observant, you may have noticed the Utah Jazz were “off the charts” as well — just in the opposite direction. They finished dead last in both turnover rate (17%) and opponent turnover rate (11.6%). Maybe it’s all part of the plan to land Cooper Flagg in the draft.
The Refs Won’t Save My Nuggets
(Yes, it’s a double entendre. I regret nothing.)
So no, the Thunder don’t rely on free throws to win games. They’ve been dominating through solid shooting, excellent ball control, and great defense.
Bottom line: A tighter whistle won’t do much to help my Denver Nuggets if they get past the Clippers tonight and face the Thunder in Round 2. The Thunder are just too good in too many ways.
If the Nuggets are going to pull off the upset — assuming they make it that far — they’ll need to shoot lights out and take care of the ball.
It’s a long shot. But you know who’s really good at long shots? Nikola Jokić!